
I'm Ben! 👋




Role
Senior product designer, Element AI, 2018 to 2019
Team
A research colleague, developers building the AI model, solution strategists and the business team
Platform
Web: a model demo and a vessel tracking platform
Summary
The Port of Montreal and other Canadian port authorities could only place a ship’s arrival within a window of give or take a week. With a colleague, I interviewed port authority and terminal teams and found they needed to see how an arrival estimate changed over time. While our developers built the prediction model, I designed two products around it: a demo that replays past voyages against the model, and a tracking platform where operators correct the events behind each estimate. Our team showcased the demo at a conference, and I took the platform to an interactive prototype.


The Port of Montreal, along with other Canadian port authorities, came to our team with one problem: ships kept arriving outside the window they expected. We started the Vessel ETA project, VETA, to find where software could help the whole port ecosystem.
The cause was a clash of interests. Vessel operators move cargo while keeping fuel costs low, so they slow down whenever they can. Ports want each ship inside a one-day arrival window so offloading crews and berths are ready. Weather, shipping routes, tides and currents shift arrivals further, and operators have no financial reason to speed up for a port’s timetable.
The workaround was a phone call. Ports asked the last port of call when the vessel had left, then estimated an arrival give or take a week. Calling the crew rarely added much confidence.

A colleague and I interviewed people on both sides of the dock. Port authority teams needed to know when to have people ready to help vessels through the difficult waters of the Saint-Laurent. Terminal operators needed to staff their offloading teams so ocean liners turned around faster, which helped their reputation and the throughput of their terminal.
Both groups asked for predictability, and both kept returning to how an arrival evolves over time. A single date wasn’t enough. They wanted to see the estimate move.
Those findings shaped the data work. Our developers and solution strategists reached out to data providers to complement the historical data the terminals and port authorities shared, so the model could do better than the method ports already used.

While the developers built the model, I drafted the features the software could offer. The business team also needed to show Canada’s maritime and logistics players what the model could do, so we ran it against the historical data and let people judge its accuracy through time. I designed the demo to feel like a finished product, so it could keep monitoring the model later and give the sales team solid presentation material.

The welcome screen. I made the water bubble animation in After Effects so the screen could also serve as a conference backdrop.
From the welcome screen, you pick a port. The port view shows the model’s accuracy for that port and every vessel that visited it, each with its average ETA accuracy. Filtering the ocean liners updates the Combined Delta ETA chart, which compares the model with traditional estimates.
The vessel view goes one ship deeper. You pick a past trip and compare the model’s prediction with the ETA the port had at the time, while a globe replays where each estimate placed the ship against where it actually was. Our team showcased the demo at a conference event.

Vessel view. A past trip replayed with the ship’s actual position, the model’s estimate and the reported ETA.

While the demo was in development, I kept designing the product itself: vessel tracking and data validation software for port and terminal teams. I took it to an interactive prototype.
After logging in, users see every inbound vessel on a world map. Selecting a ship shows useful details about the vessel and its predicted arrival time.
The platform also let operators correct the model. When they knew about events a ship had been through, they could validate or dismiss them, and that feedback recalculated the ETA. They could also add inbound vessels the software wasn’t tracking yet, which improved the model in later updates.
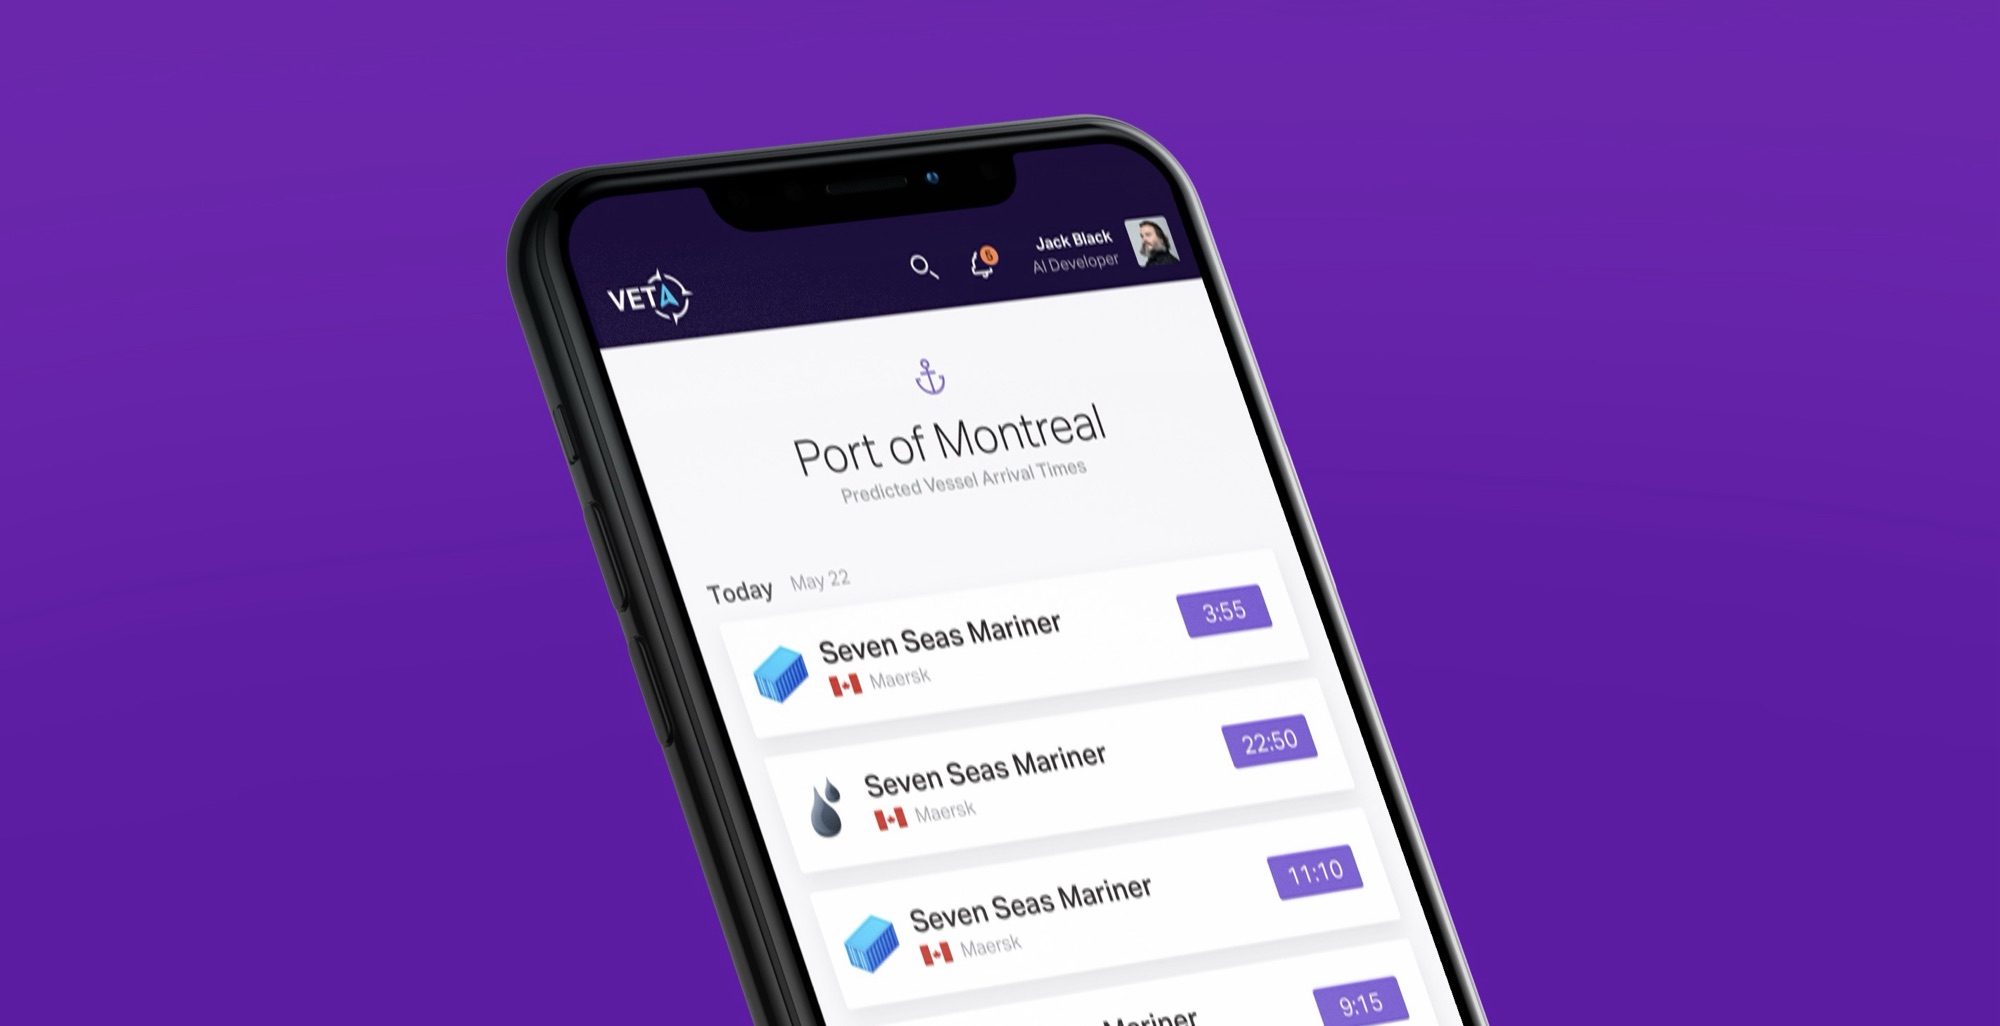
A mobile view of predicted arrival times for the Port of Montreal.
The idea behind the work
People trust a prediction they can watch move.
Port teams wanted more than one more date. They wanted to see how an estimate changed, why, and a way to correct it.

With a colleague, I interviewed port authority and terminal teams before designing screens. Their shared need, seeing how an arrival evolves, shaped both products.
Interviews with port authorities and terminal operators

I designed the demo so people could replay real past trips and compare the model with the ETAs ports had at the time, on a map and a chart.
Showcased by our team at a conference event

While developers built the model, I drafted the product’s features, then designed the tracking platform in parallel with the demo’s development.

Show the trajectory of a prediction
Users wanted to know how much to trust an estimate and whether that was changing. Designing for how a prediction evolves mattered more than the single number.

Let experts feed the model
Operators who validated events became part of improving the predictions, which helped accuracy and trust.
Credits: Designed at Element AI with a research colleague, the development team, solution strategists and the business team.
