
I'm Ben! 👋




Role
Senior product designer, 2018 to 2019
Team
Element AI’s ML engineers and me
Platform
Desktop web app for airline operations control
Summary
In airline operations, one late flight at a hub can strand crews and aircraft and spread delays across the network, and operations teams only saw the problem once it was already happening. At Element AI, I designed a forecasting tool that shows operations staff which upcoming flights are likely to be delayed or cancelled, and how likely. Every warning carries its probability, the expected delay and what else is at risk, so a 75% warning reads differently from a 50% one. The final design covered the full loop, from the prediction list to flight details, resolving a flight and setting alert thresholds.

In aviation, irregular operations is the name for a bad day at scale. One delayed flight at a hub can leave crews timed out and aircraft out of position, and connecting passengers miss their flights.
Our airline partner wanted to get ahead of disruptions instead of reacting to them. Their operations centers already had plenty of data from weather, maintenance, crew scheduling and flight tracking. What they lacked was one forward-looking view that pulled those signals together. Operators watched several screens and assembled the picture in their heads, which worked when the most experienced people were on shift.
The stakes cut both ways. Cancelling a flight that would have been fine costs money and annoys passengers. Ignoring a warning that turns out to be real costs more. Operators needed to make that call quickly and with the right amount of confidence.

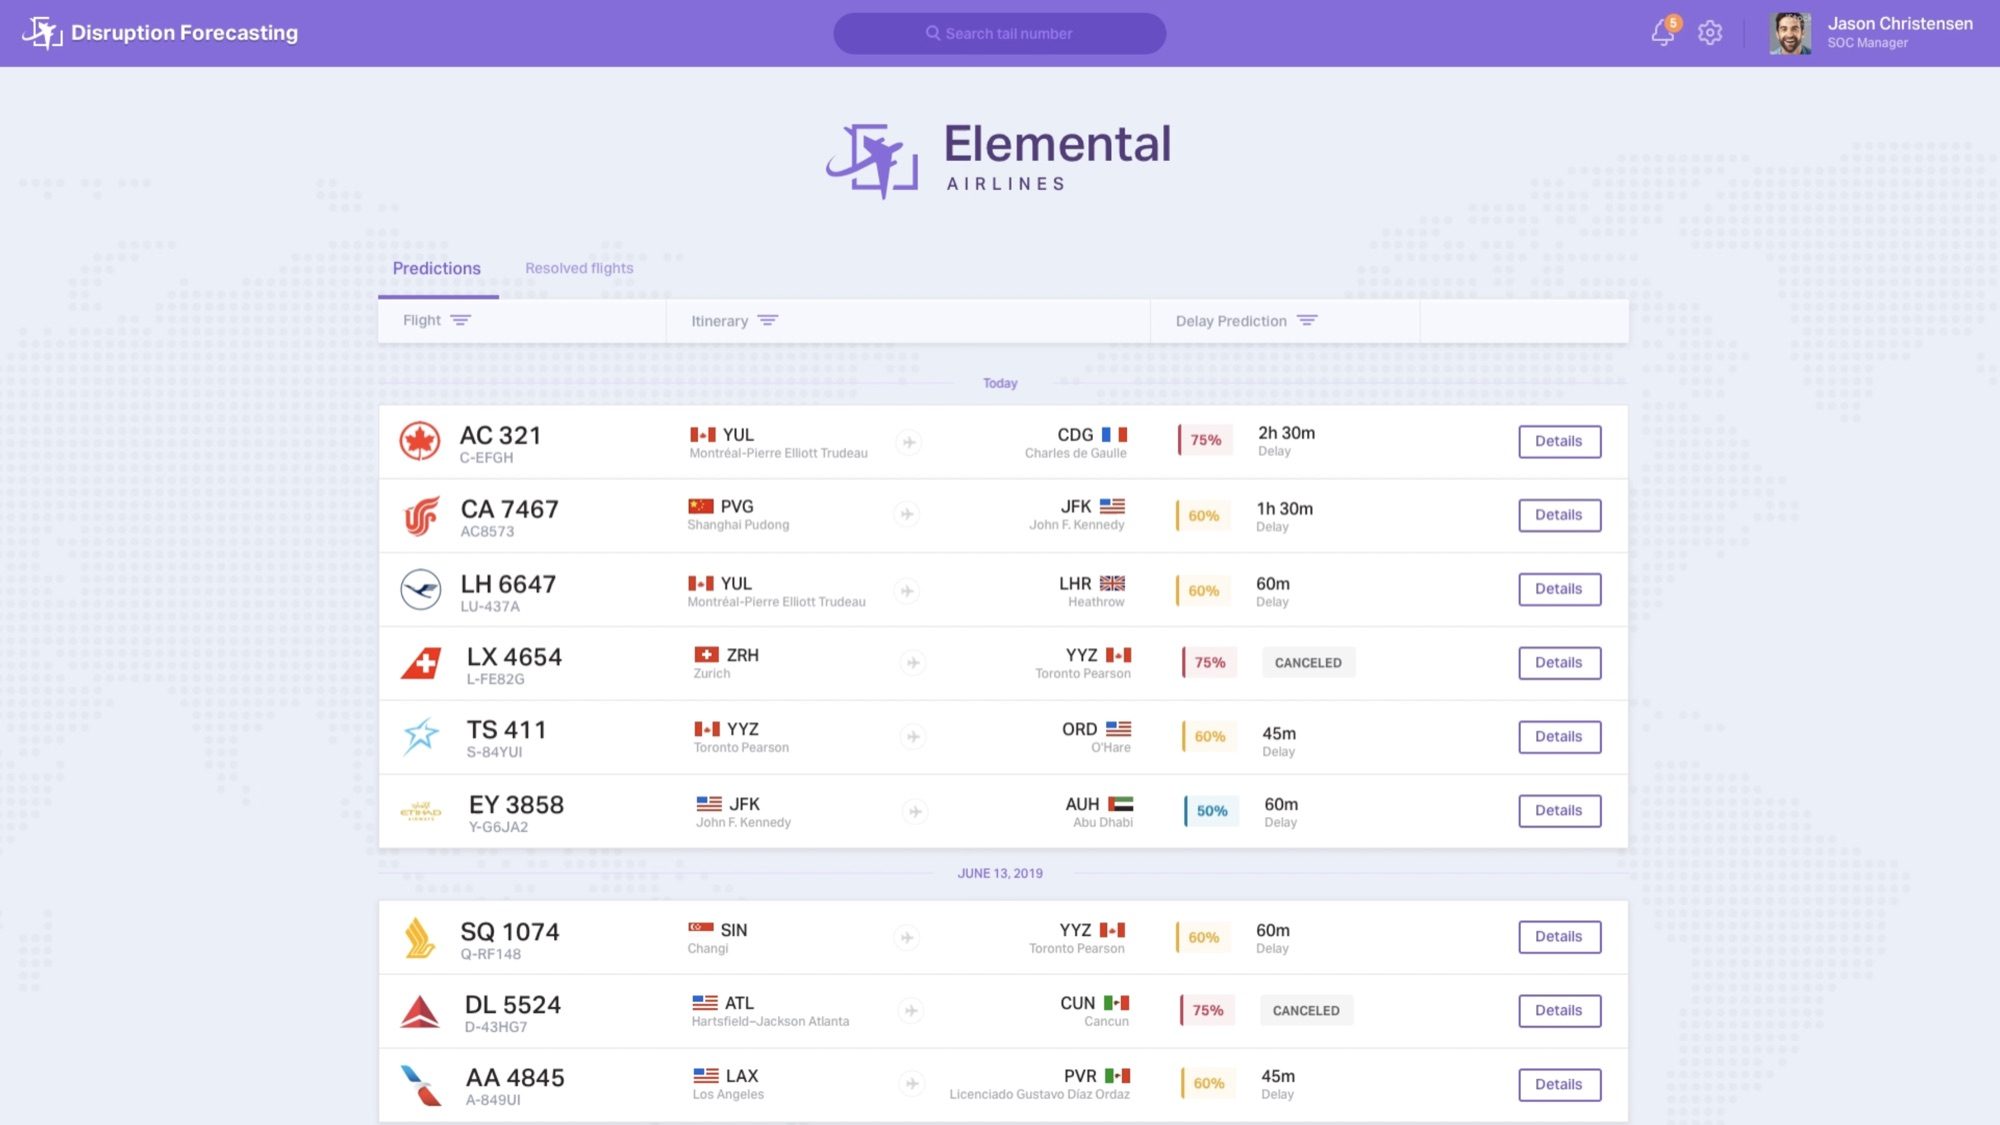
Existing tools showed the current state of the operation. I built the main view around what was likely to happen next: a list of upcoming flights, grouped by day, each with its route, its probability of disruption and the expected outcome, either a delay length or a predicted cancellation.
Not all forecasts are equal, and the interface had to say so. With the ML engineers, I settled on showing each prediction as a percentage beside the delay it refers to, color-coded so a 75% warning reads differently from a 50% one. Without that, operators either ignore forecasts or overreact to them.
Operations staff already watch several screens at once, so every column had to earn its place. A tail number search covers the moment an operator already knows which aircraft they care about.

A warning without context is just more noise. Opening a flight shows its scheduled and predicted departure and arrival times side by side, then a delay distribution: the model’s odds across a range of delay lengths, with the most likely one called out, such as a 75% chance of a 2h 30m delay. A last update time and a refresh button show how fresh the prediction is.
Beside it sit the aircraft type and passenger figures by cabin. Below it is the part that answers the cascade problem directly: the next flights this aircraft is scheduled to fly, each with its own delay prediction. An operator sees in one place how far a single late departure will travel.
Alert fatigue was the last risk. If the tool flagged everything, operators would learn to tune it out. In settings, each operator chooses when to be notified: when a new delay prediction arises, or when a flight’s delay probability rises sharply. Two thresholds, a minimum delay and a minimum probability, keep small or unlikely delays off their screen.
Once a flight has been handled, the operator marks it as resolved and it moves to a separate tab, where it can be marked unresolved again. The prediction list then shows only what still needs attention.
The final design covered that whole loop, from spotting a likely delay to seeing its knock-on effects and clearing it once it was dealt with.
The idea behind the work
A forecast only helps if people know how far to trust it.
Operators who don’t trust a forecast ignore it, and operators who trust it too much overreact, so every screen kept the model’s confidence next to its prediction.

I worked with the ML engineers to express each prediction in terms an operator acts on: a probability, an expected delay and the flights affected.
The detail view states the odds plainly, such as a 75% chance of a 2h 30m delay.

In a room full of screens, adding data does not help. I kept the list to what an operator needs to decide and moved the rest one click away.

A delayed flight is one point in a network. I designed the detail view around the aircraft’s next flights so the cascade is visible before it happens.
Every flight’s details include its aircraft’s next scheduled flights and their risk.

Trust calibration became a rule
This project is where showing how sure the model is became a rule I apply to every AI product I design.

Dense data needs a strict hierarchy
The most useful design decisions here were about what to leave off the screen.
Credits: Designed at Element AI with the ML engineering team. Airlines, flights and people in the screens are demo data.
